


Library of Congress
Using Maps in Instruction
Teach Science, Social Studies and Mathematics to your K-12 students using copies of world and local historic maps.
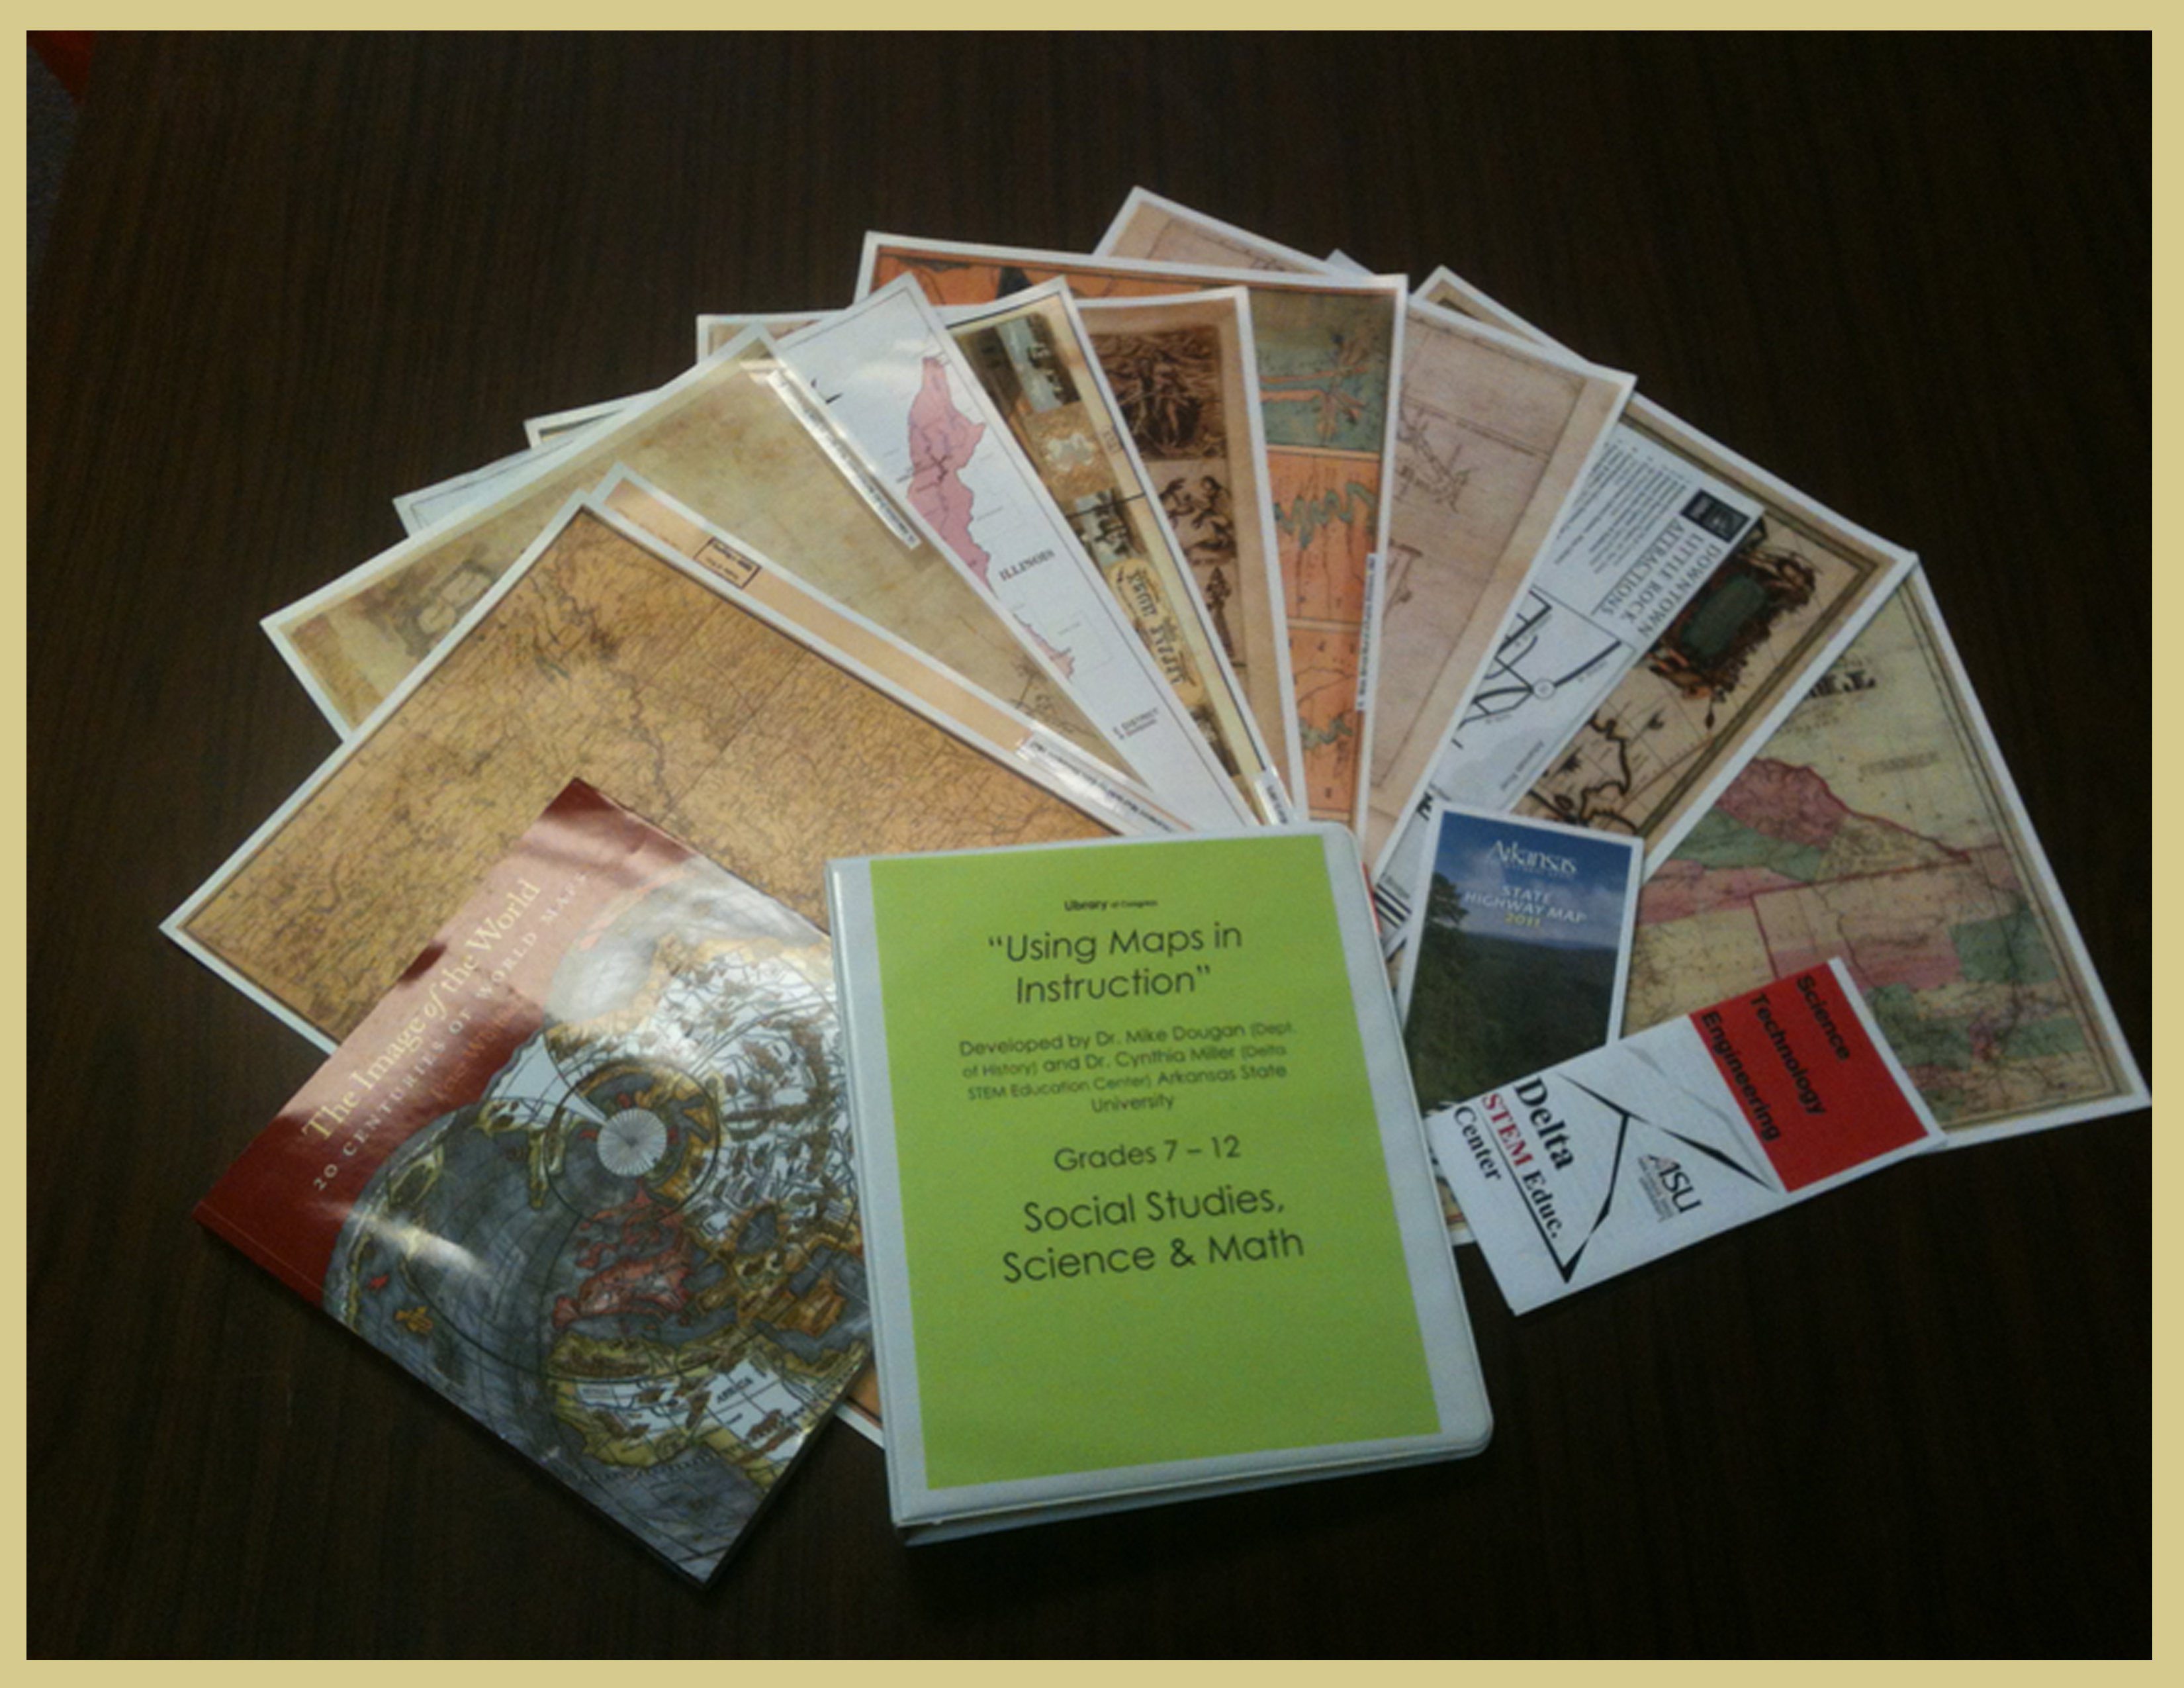
This traveling suitcase exhibit, Using Maps in Instruction, consists of printed copies of Library of Congress Maps, road maps, a binder containing 5 E-lesson plans, and activities for each of the enclosed maps, articles, and a flash drive containing lesson plans and other resource materials. Lesson plans were written by 15 participants of a workshop led by Dr. Cynthia Miller of ASU's Delta STEM Education Center and Dr. Michael Dougan of the ASU History Department.
Funded by Library of Congress
Using Library of Congress Maps to Teach Gr. 7-12 Science, Social Studies, & Math. (2011-2012)
Arkansas Standards for Maps in Instruction
Analysis of Topographical Maps of the Geologic Regions of AR
G.8.3.2 (D2.Geo.2.3-5 )
Use thematic maps (e.g., climate, political, physical) and other geographic representations to describe physical and human characteristics of a variety of places in Arkansas and the interactions that shape them
Contributions of Benjamin Franklin as a Scientist and Inventor
RST.6-8.3 (7-PS1-6)
Follow precisely a multistep procedure when carrying out experiments, taking measurements, or performing technical tasks.
7-ETS1-1
Define the criteria and constraints of a design problem with sufficient precision to ensure a successful solution, taking into account relevant scientific principles and potential impacts on people and the natural environment that may limit possible solutions.
Crossing the Bridge
RI.5.7, 5-ESS2-1, 5-ESS3-1
Draw on information from multiple print or digital sources, demonstrating the ability to locate an answer to a question quickly or to solve a problem efficiently.
Population Growth as percentages
AR.Math.Content.7.RP.A.3
Use proportional relationships to solve multi-step ratio and percent problems.
GPS Scavenger Hunt
G.8.3.2 (D2.Geo.2.3-5 )
Use thematic maps (e.g., climate, political, physical) and other geographic representations to describe physical and human characteristics of a variety of places in Arkansas and the interactions that shape them
RST.6-8.3 (7-PS1-6)
Follow precisely a multistep procedure when carrying out experiments, taking measurements, or performing technical tasks.
EVS3-ETS1-3
Evaluate a solution to a complex real-world problem based on prioritized criteria and tradeoffs that account for a range of constraints, including cost, safety, reliability and aesthetics as well as possible social, cultural, and environmental impacts.
Comparing and Contrasting Utilizing Graphic Organizer
RI.3.7
Use information gained from illustrations (e.g., maps, photographs) and the words in a text to demonstrate understanding of the test (e.g., where, when, why and how key events occur).
Where Did They Go?—Trail of Tears Routes and Destinations
Era1.1.AH.9-12.2
Analyze the impact of European explorers on native populations and the environment from multiple perspectives
Era1.1.AH.9-12.3
Analyze reasons for migration to pre-territorial Arkansas using a variety of sources (e.g., physical geography, natural resources)
Era2.2.AH.9-12.1
Evaluate intended and unintended consequences of public policies (e.g., Louisiana Purchase, Missouri Compromise, Indian Removal)
Feast or Famine: Life in Arkansas in 1910
G.1.AH.7-8.1
Compare and contrast the six geographic regions of Arkansas using geographic representations and available geospatial technologies.
AR.Math.Content.8.SP.A.1 & 2
- Construct and interpret scatter plots for bivariate measurement data to investigate patterns of association between two quantities
- Describe patterns such as clustering, outliers, positive or negative association, linear association, and nonlinear association
- Know that strait lines are widely used to model relationships betwwen two quantitative variables
- For scatter plots that suggest a linear association, informally fit a straight line, and informally assess the model fit by judging the closeness of the data points to the line
PSI-ESS3-1
Construct an explanation based on evidence for how the availability of natural resources, occurrences of natural hazards, and changes on climate have influenced human activity.
Lewis and Clark: Why Explore the Vast Unknown?
Era1.1.AH.9-12.2
Analyze the impact of European explorers on native populations and the environment from multiple perspectives
Era1.1.AH.9-12.3
Analyze reasons for migration to pre-territorial Arkansas using a variety of sources (e.g., physical geography, natural resources)
Era2.2.AH.9-12.1
Evaluate intended and unintended consequences of public policies (e.g., Louisiana Purchase, Missouri Compromise, Indian Removal)
The Louisiana Purchase
Era1.1.AH.9-12.2
Analyze the impact of European explorers on native populations and the environment from multiple perspectives
Era1.1.AH.9-12.3
Analyze reasons for migration to pre-territorial Arkansas using a variety of sources (e.g., physical geography, natural resources)
Era2.2.AH.9-12.1
Evaluate intended and unintended consequences of public policies (e.g., Louisiana Purchase, Missouri Compromise, Indian Removal)
Era2.2.AH.9-12.2
Explain the process leading to and advantages of territorial status
Understanding Differences in Colonial Development
Era.4.1.8.1
Analyze multiple factors that affected territorial expansion and influenced the perspectives of people
Era2.2.AH.9-12.5
Evaluate reasons for and impact of human settlement on various regions
Perpendicularity of the Arkansas Capitol Building in Little Rock, AR
AR.Math.Content.5.G.A.1
Use a pair of perpendicular number lines, called axes, to define a coordinate system with the intersection of the lines (the origin) arranged to coincide with the 0 on each line and a given point in the plane located by using an ordered pair of numbers called, its coordinates
HSG.MG.A.3
Apply geometric methods to solve design problems (e.g., designing an object or structure to satisfy physical constraints or minimize cost; working with typographic grid systems based on ratios)
Discover Maps
7-PS1-3
Gather, read, and synthesize information from multiple appropriate sources and assess the credibility, accuracy, and possible bias of each publication and methods used, and describe how they are supported or not supported by evidence (Science and Engineering Practices).
The road less traveled or the Well-Traveled Road
D.5.7.1
Collect data from multiple sources using a variety of tools (e.g., analog, digital)
IL.3.6.1
Critique and revise a completed task using established criteria, with guidance
IL.2.8.2
Manage and prioritize information from a wide variety of resources based on relevance and credibility.